HYPOTHESIS
I. What is Hypothesis Testing?
the statistical method applied in making decisions using experimental data.
testing an assumption made about the population.
II. What is Hypothesis?
proposed explanation, assertion or assumption (about a population parameter or distribution of the random variable)
Null Hypothesis (H0)
- no significant difference. It is what the researcher tries to disprove, reject, or nullify.
NOTE: You can think of null hypothesis as the CURRENT value you want to disprove in favor of alternative hypothesis.
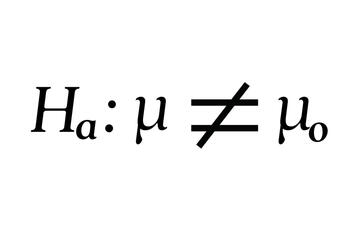
Alternative Hypothesis (Ha)
- with real effect.
| Testing Hypothesis |
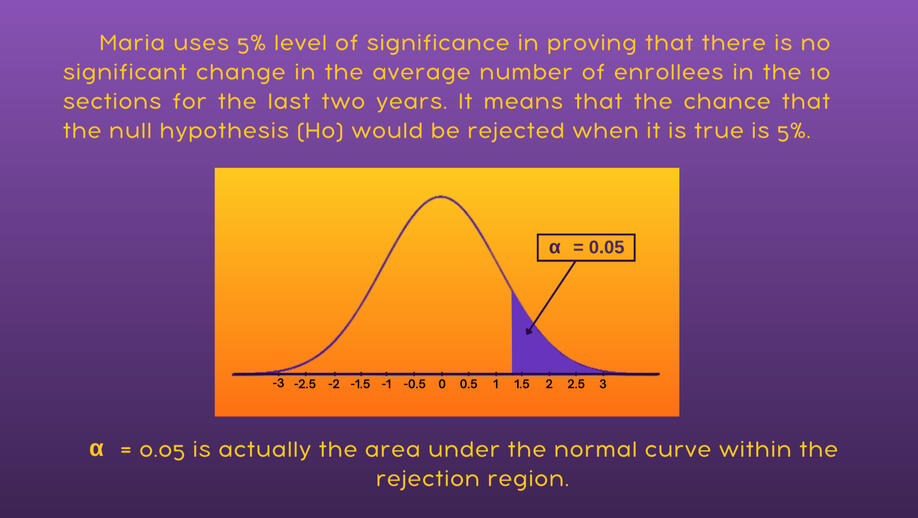
III. Level of Significance (α/alpha)
degree of significance in which we accept or reject the null.
100% accuracy = not possible to accept/reject a hypothesis.
Significance level (α / alpha) - is the probability of making the wrong decision when the null is true.
Most common level of significance used = 1%, 5%, or 10%
IV. Two-tailed Test
when the alternative hypothesis is TWO sided.
V. One-tailed Test
hypothesis assumes a less than or greater than value.
| Graph Illustration |
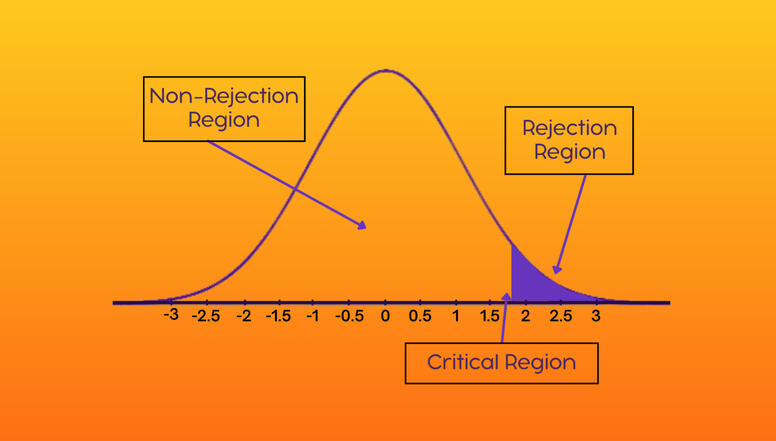
VI. Rejection Region (also known as critical region)
is the set of all values of the test statistic that causes us to reject the null.
VII. Acceptance Region (non-rejection region)
is the set of all values or the test statistic that causes us to accept or fail to reject the null.
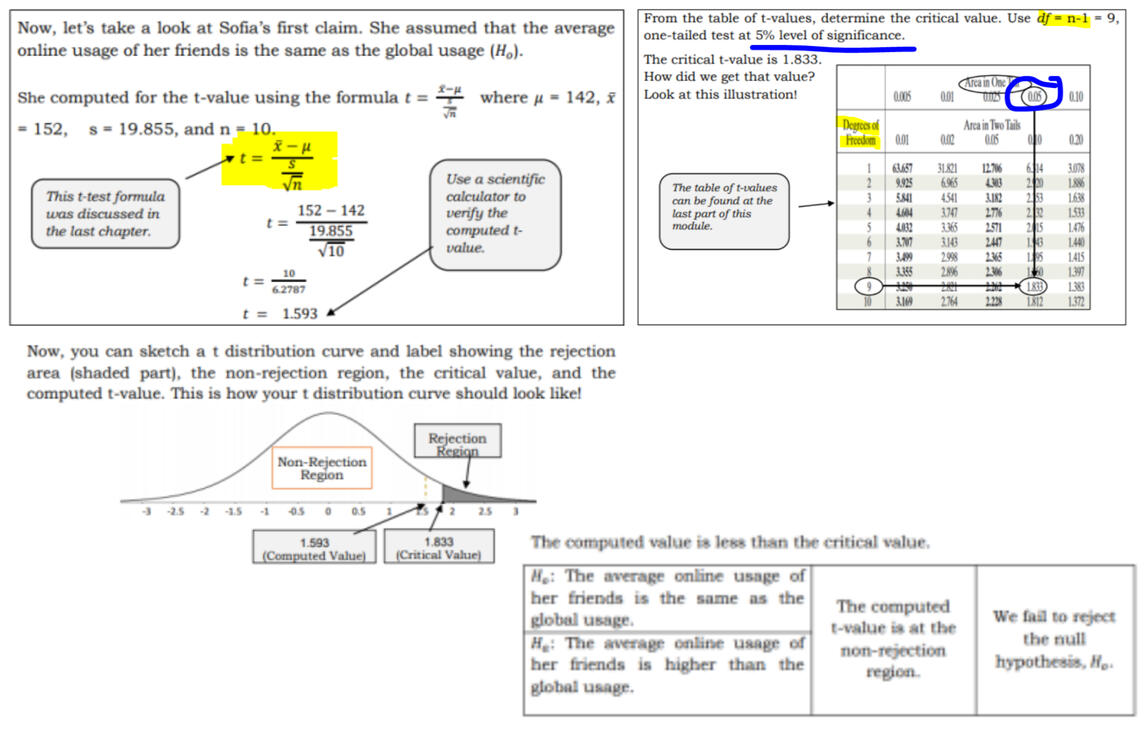
VIII. Critical Value
ㅤ
is a point boundary on the test distribution that is compared to the test statistic to determine if the null would be rejected.
How to use T-Test?
| Errors |
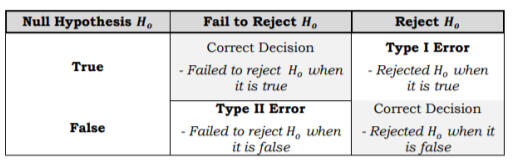
IX. Type I Error
probability denoted by (α) alpha. Rejecting null when TRUE. (DOCTOR)
X. Type II Error
probability denoted by beta (β). Accepting null hypothesis when it is FALSE. (Nascam)
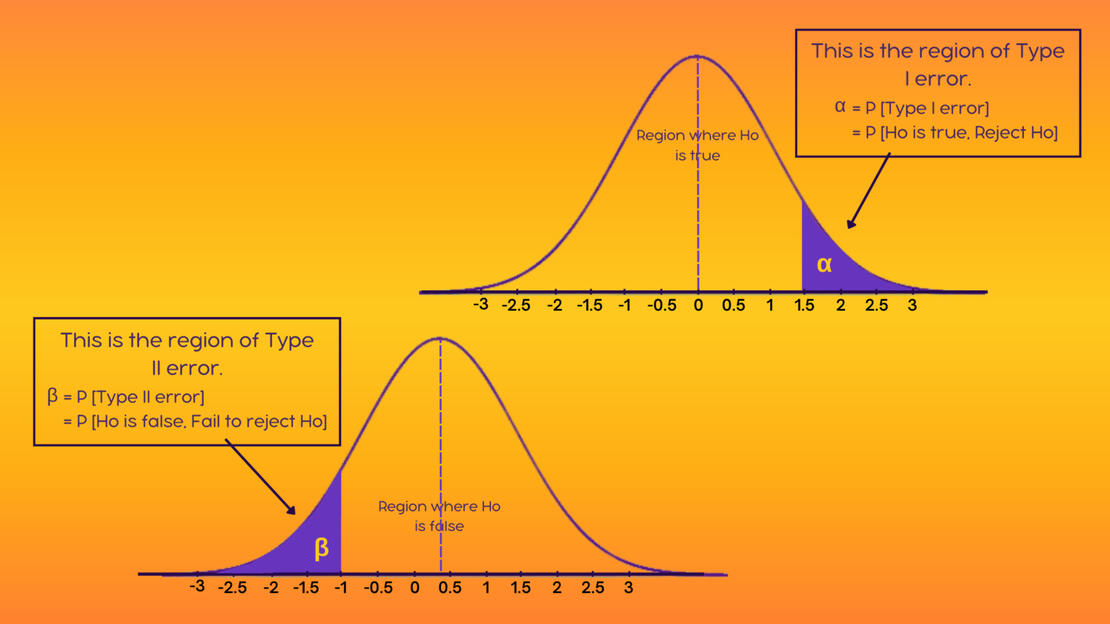
Alpha region - normal curve that shows the critical region.
ㅤ
Beta region - normal curve that shows the acceptance region.